%20-%20120%20x%2044.svg)
You can generate a range of reports relating to your sales. To access them, go to Reports > Financial. Click on the report you wish to generate, select the date range you are interested in and then run the report. All reports can be printed, export to Excel for further analysis and custom sorting, or exported as a PDF.
Financial reports require the Access Financial Reports permission. If the account is in Storage Mode, use Tools > Data Export to export historical account data instead of relying on Reports > Financial.
In this article:
- Activity Summary
- Invoices & Payments
- Sales
- NDIS Bulk Upload (AUS only)
- Accounts Receivable
- Aged Receivables
- Frequently Asked Questions
- Related Articles
Activity Summary
- This report gives an overview of all appointment, invoicing and payment activity for the period.
- Produces four sections:
- Appointments: Includes appointments booked during the reporting period. Useful for checking which appointments have been invoiced (which can be seen by which appointment have an invoice number listed), and which have been paid.
- Sales Without Appointments: Shows all invoices produced that are not associated with an appointment. Typically for product sales.
- Payments: Shows all payments received in the period, along with details of which invoice the payment is allocated to (if allocated).
- Payments Reconciliation: Gross sales for all appointments that have services assigned to them.
Appointments are displayed if their start date is within the specified date range. Therefore, you can also use this report to predict future sales. The total outstanding payments figure displays the value for all appointments that haven't been received.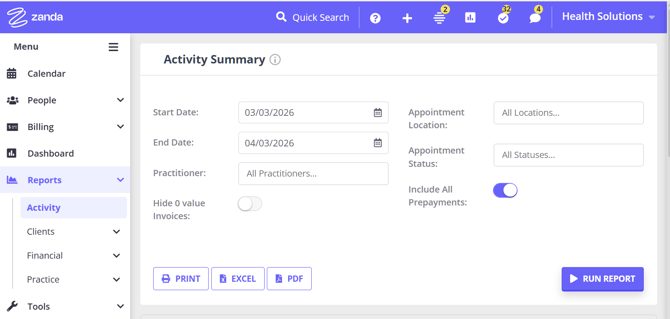
Invoices & Payments
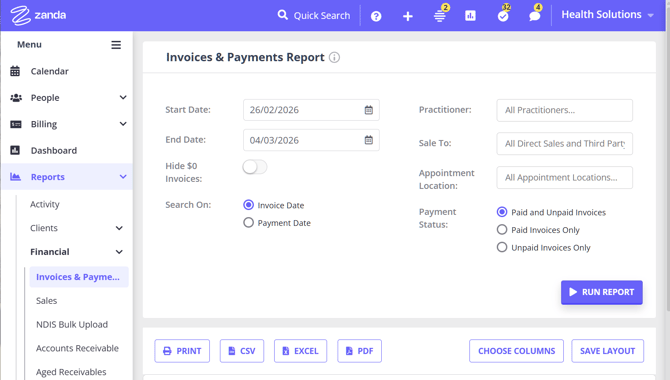
- Displays all service and product sales & payments based on appointment or payment date. Can be used for GST Sales for BAS.
- Report on Invoice Date or Payment Date.
- Includes invoice number, date of invoice, client name and client ID number, calendar/practitioner, location name, description (name of service/product), invoice total, tax amount, date paid, payment method, amount paid, amount owing, internal invoice notes, File Under entries from Client Profile > Details page.
Sales
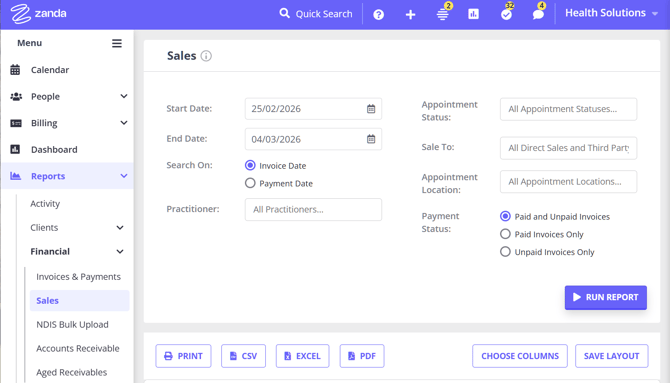
- Breakdown of how many products and services were sold over a date range for each employee.
- Group by Type and then Item to see the total quantity of each service, product, or session pack sold in that period of time.
- Includes invoice number, date of sale, client name, client number ( to allow for exporting the data without including identifying client details), calendar/practitioner, Location, appointment date (if the invoice is associated to an appointment), type of sale (service, product, session pack), item sold (either service or product name), time/duration (relevant for services), total invoices amount, tax included.
💡 Tip: Sales reports item by item, so it is the report to use when you need what a service or product was charged at on a past date. Invoices & Payments reports at invoice level and shows the invoice total instead. See Adding and Editing Services for where past prices are kept.
NDIS Bulk Upload (AUS-only)
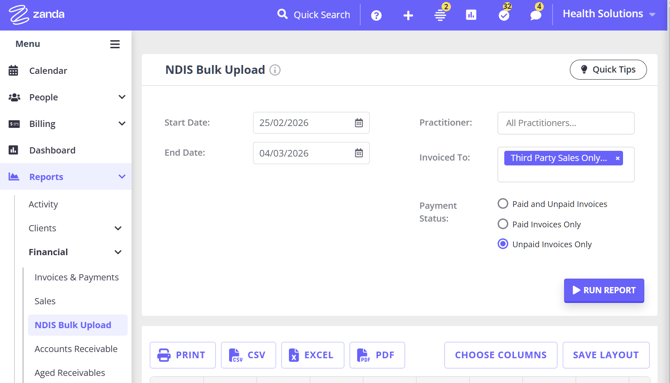
This report is only available in Zanda accounts that have 'Australia' set up as the country in User Menu > Account Settings > Practice > Business Info.
This report generates a list of invoiced services for NDIA-managed clients that can be exported to CSV and then uploaded to the NDIS myplace portal to bulk request payments.
Accounts Receivables
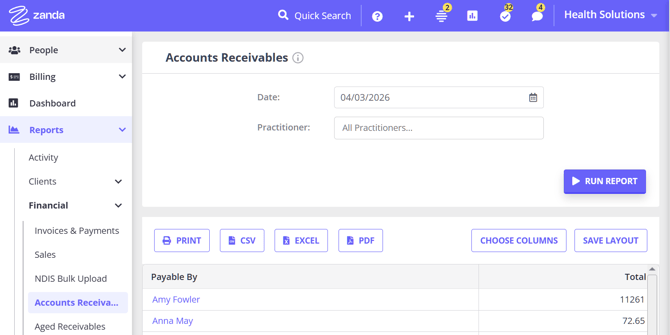
- Shows all outstanding invoices for clients as of a particular date.
- For example, a report on what invoices were outstanding as of the last financial year for tax purposes.
- Includes the entity payable by, and the total amount owing by each. The sum of the outstanding amount is listed at the bottom of the report.
Aged Receivables
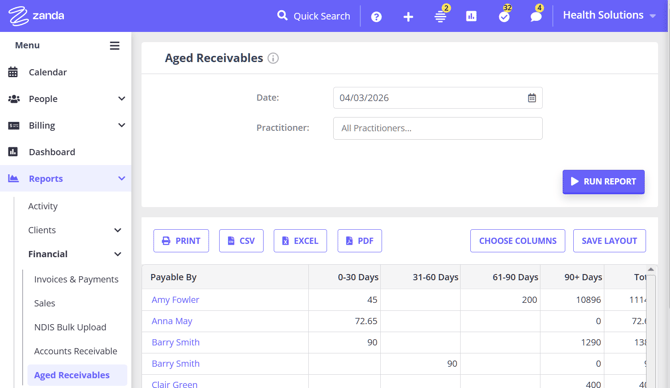
- Shows which account are in arrears as at the current point in time or at the date that you selected. Use this to an accurate list of what is owed at the date used to run this report.
- Includes the entity payable by and a summary of the outstanding amount based on periods of 0-30 days, 31-60 days, 61-90 days, 90+days, and a total sum of owed payments.
💡 Pro Tip Accounts Receivable and Aged Receivables don't support grouping or extra filters beyond date and practitioner. If you need to filter or group receivables by who's paying, for example, to separate what clients owe from what's pending with an insurer, use the Invoices & Payments report instead, which supports both. See Grouping Reports.
Frequently Asked Questions
❓ I can't see Reports > Financial in my menu — where has it gone?
It hasn't moved. The Financial section appears under Reports only for users who have the Access Financial Reports permission. If that permission is turned off for your user, the whole section is hidden rather than greyed out, so Invoices & Payments , Sales , Accounts Receivable and the other financial reports disappear from the menu together. The rest of the Reports menu stays visible because Reports > Clients and Reports > Practice are also unlocked by Access Client Reports. Opening a financial report by its web address won't get you around it either, as the reports themselves are covered by the same permission.
To get the section back, ask a Master User (or anyone who manages users) to turn Access Financial Reports back on for your user under User Menu > Account Settings > Team > Users. A Master User always sees the section.
When enabling it, check you have the right permission: Access Client Invoices and Payments sits alongside it in the Financial permissions list, but that one controls the client Billing menu, not Reports > Financial.
Access Financial Reports also unlocks a few items outside the Financial section, so these return at the same time: Reports > Activity , Reports > Clients > Client Sources , the Telehealth Sessions , SMS Usage , AI Scribe Usage and Recent Referrals reports under Reports > Practice , and Tools > Xero Export.
❓ Why is a partial payment not appearing in Invoices & Payments?
To report on partial payments in Invoices & Payments, set Search On to Payment Date, and choose Paid and Unpaid Invoices in the Payment Status filter. Partially paid invoices may not appear under Paid Invoices Only until the invoice is fully paid, so use Paid and Unpaid Invoices to include invoices with a remaining balance. In the report results, review How Paid, Amount Paid, and Owing to check the payment method, paid amount, and amount still owing.
❓ Can I see which outstanding balances a client owes personally, separate from balances an insurance company is still processing?
Yes: run Invoices & Payments and use the Sale To filter to split results by who is billed:
- Go to Reports > Financial > Invoices & Payments.
- Set Payment Status to Unpaid Invoices Only so the results show only outstanding balances.
- Set Sale To to Direct Sales Only and run the report: this shows invoices billed straight to the client, the balances they owe personally.
- Run the report again with Sale To set to Third Party Sales Only, or pick a specific third party from the same list: this shows invoices billed to that third party instead of the client.
- Check the Payable By and Owing columns on each run to confirm who owes each amount and how much.
Accounts Receivable and Aged Receivables also show a Payable By column, but neither has a Sale To filter or supports grouping, so they can't be split this way—use Invoices & Payments for this instead.
❓ How do I report on revenue for an inactive practitioner?
The Practitioner filter in Invoices & Payments lists active practitioners. To report on revenue for a practitioner who is currently inactive, temporarily reactivate their practitioner profile, run the report, and then deactivate the practitioner again when you have finished.
- Go to User Menu > Account Settings > Team > Practitioners.
- Turn on Show Inactive, then open the inactive practitioner profile.
- Turn on the Active toggle and click Save.
- Go to Reports > Financial > Invoices & Payments.
- Set the Start Date and End Date for the financial year you want to report on.
- Select the practitioner from the Practitioner filter.
- Use Search On and Payment Status to match the revenue view you need, then run or export the report.
- Return to the practitioner profile, turn off the Active toggle, and click Save.
For detailed reactivation steps, see Adding and Editing Practitioners.
❓ How do I exclude the card processing fee from the Invoices & Payments report?
The Invoices & Payments report does not have a filter to remove the Stripe card processing fee. The fee is recorded on the invoice as its own line item, Card Processing Fee, so the report counts it in the totals like any other service or product, and there is no setting to hide or subtract it inside the report.
Because the fee sits on its own line, you can separate it after exporting:
- Go to Reports > Financial > Invoices & Payments and set your date range and filters. For example, set Search On to Payment Date if you are working out pay based on payments received.
- Use Choose Columns to include the Description column so the Card Processing Fee lines are visible.
- Click Excel (or CSV) to export the results.
- In the spreadsheet, filter or remove the rows where the Description is Card Processing Fee , then re-total the remaining amounts to get the figure without the fee.
This gives you a sales or payment total that excludes the card processing fee — useful when a practitioner's pay should not include the fee, since the practice retains the fee to cover the transaction cost.
If you would like a built-in option to exclude the card processing fee from this report, you can submit the request through the Customer Ideas Portal.
❓ Can I search for invoices by amount?
Yes. For a quick lookup, use the Quick Search bar, select Invoices, and enter the invoice total you want to find. Quick Search matches invoice totals, invoice numbers, and client details.
For reporting, go to Reports > Financial > Invoices & Payments, run the report for the date range and filters you need, and then use the column filter menu on Invoice Total, Amount Paid, or Owing to refine the results by amount. You can use this when you need to find invoices with a specific total, check payments of a certain amount, or review invoices with an amount still owing.
❓ Why do prepayments look different in Billing > Payments and financial reports?
Use Billing > Payments when you need a payment-level list that can include unallocated prepayments. Turn on Include All Prepayments to include payments that have been recorded but not allocated to an invoice yet.
Use Reports > Financial > Invoices & Payments or Reports > Financial > Sales when you need invoice-based reporting. These reports show invoices and payments allocated to invoices, so an unallocated prepayment appears after it has been allocated to an invoice. To review allocated payments by payment date, set Search On to Payment Date and use Paid and Unpaid Invoices when you need to include partially paid invoices.
❓ How do I find each practitioner's average session fee and average weekly sessions?
You can work out both averages from the Sales report, which lists every service sale with its practitioner, amount, and duration. Zanda does not show them as a single figure, so you calculate them from that report.
- Go to Reports > Financial > Sales and set the Date Range you want to measure.
- Filter or group the report by calendar/practitioner so each practitioner's service sales sit together. To group, drag the Practitioner column into the grouping area (see Grouping Reports). Export to Excel or CSV if you would like to total and divide the figures in a spreadsheet.
- Average session fee: divide the practitioner's total service sales by their number of service lines for the period. Each booked service is one line, so where an appointment has a single service, the line count is the session count. If your appointments often carry more than one billed service, count appointments instead using the Activity Summary report.
- Average weekly sessions: take that same session count and divide it by the number of weeks in your date range.
For booked time rather than fees, the Practitioner Utilisation Report shows each practitioner's booked hours against their available hours over the period.
❓ Can I print just the totals from the Sales report when it is grouped by Type?
Not on its own. When you group the Sales report by Type (or Item), each group heading on screen shows that group's summary: the type, the number of lines in brackets, Total Time , Total Amount , and Tax Included. Those group headings are part of the on-screen view only. Print, PDF, CSV, and Excel always output every detail row for the period, plus a single grand total at the end, so collapsing the groups on screen does not reduce what comes out.
There are two ways to get the per-type figures:
- Take them from the screen. Go to Reports > Financial > Sales , set your date range and run the report. Drag the Type column into the grouping area at the top of the results, then collapse each group using the arrow beside it. Each group heading now shows the Total Amount and Tax Included for that type.
- Export and total in a spreadsheet. Before exporting, use Choose Columns to untick any columns you do not need, as hidden columns are left out of the export as well as the screen. Click Excel or CSV , then use a pivot table or a subtotal on the Type column to produce one line per type.
If you would like a totals-only printout built into the report, you can submit the request through the Customer Ideas Portal.
Related Articles
- Managing Users - Review and change the permissions on a user profile.
- Exporting Your Data - Export historical account data from Tools > Data Export.
- Grouping Reports - Refine report results with grouping and filtering.
- Using Report Filters and Layout - Related guidance for report filtering and layouts.